

 RTI Act
Sunlight-induced Fluorescence Imaging of Vegetation

Fig. 1. Sunlight-induced multi-spectral fluorescence imaging system for vegetation stress studies
Plant growth and development depend on photosynthetic efficiency, which in turn is related to the availability of sufficient water, mineral nutrients, carbon dioxide and light. Insufficient availability of these vital inputs due to natural or anthropogenic stress can affect the photosynthetic performance directly or indirectly, thereby altering the optical fluorescence properties. Photosynthesis is particularly sensitive to stresses, such as drought, nutrient deficiencies, acid rain, suspended particulates and air pollutants.
A multi-spectral imaging system was developed for fluorescence imaging of sunlight induced plant fluorescence from different types of vegetation (Fig. 1). The inverse dependence of plant fluorescence on photosynthetic activity is used to assess the impact of stress on plants. The small component of emitted fluorescence on absorption of solar energy is extracted from the reflectance spectra of plants by using the Fraunhofer discrimination technique. It is hoped that this instrument could aid in passive remote sensing of vegetation through the measurement of fluorescence at selected Fraunhofer lines located close to the fluorescence emission peaks, followed by digital processing of the recorded images. The study covers monitoring of vegetation health in different plant types exposed to varying climatic conditions.

Fig. 2. Variation in chlorophyll ratio of a senescent to dry leaf on dark background.
Vegetation fluorescence reflects the physiological status of plants and this principle has been applied in classification of plants, identification of vegetation characteristics, physiological and nutrient stress detection, weed infestation identification and related developments. It is well established that the intensity ratios of these emission bands, in particular the chlorophyll bands, are good indicators of photosynthetic function. In Fig. 3 the F685/F720 fluorescence intensity ratio image of a partially dry leaf is displayed in false colours with value of 0.66 for blue colour (green area of leaf) , 0.829 for green colour (senescent leaf) and 0.918 for red colour (dry leaf).
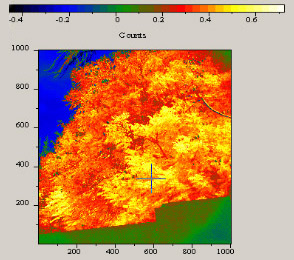
Fig. 3. False colored NDVI image of a tree 100 meter away from camera.
Reflectance images of distant trees were recorded at 720 and 687 nm with the imaging camera. From the visible and NIR light reflected by vegetation, the Normalized Difference Vegetation Index (NDVI) that describes plant productivity was computed using the relation NDVI= (NIR-VIS)/ (NIR+VIS). For the green denser region of vegetation, the NDVI ranges from 0.5 to 0.7. The false coloured NDVI image of a tree is shown in Fig. 3; the area with vegetation is shown as red to yellow in colour with the NDVI varying from 0.2 to 0.6. Healthy vegetation absorbs most of the visible light that falls on it and reflects a large portion of the NIR light. Unhealthy or sparse vegetation reflects more visible light and less NIR light, yielding a lower NDVI. The fluorescence ratio F687/F720 shows increasing trend with senescence from 1.22 to 1.35 while the NDVI from the corresponding image area shows a decreasing trend from 0.27 to 0.13.